Optimizing Data Quality in Tanzania

Tanzania has made considerable advancements in establishing national and integrated health information systems using the District Health Information Software 2 (DHIS2) platform. The DHIS2 is an aggregate reporting tool for health management data that is used to gather and analyze data across Tanzania’s 169 districts. Data are used across all levels to measure performance against targets, address challenges, and identify strategies that improve health services delivery. Despite these advancements, however, challenges remained in optimizing data quality.
Usually, facility (and sometimes district) data officers enter data manually, which makes it prone to human errors. Data quality assessments at facility and district levels vary regarding training and availability of personnel, which results in issues with data timeliness, completeness, consistency, and accuracy — and because the data is sometimes unreliable, data visualization is limited. Insufficient human resources has also resulted in barriers to accessing, analyzing, and interpreting the data.
Starting in October 2018, Ciheb in Tanzania, under the leadership of Ministry of Health, Community Development, Gender, Elderly and Children (MOHCDGEC), collaborated with regional and council health management teams (R/CHMT) to identify, develop, and implement solutions aimed to improve the efficiency of data quality assessment (DQA) processes.
Real-time DQA Integration with the National DHIS-2 Platform
Ciheb, with support from PEPFAR, collaborated with MOHCDGEC to develop a data demand and information use (DDIU) real-time DQA tool integrated with the national DHIS-2 platform.
The DDIU real-time DQA is now integrated with the national DHIS-2 system. Following data entry at the district level, data officers use the DDIU real-time DQA monitoring tool to conduct automated data quality checks. The DDIU flags data that require further investigation, which reduces hours of data quality assessment to approximately 10 minutes. The automated identification of outliers, implausible values, or inconsistencies with other data elements enable the data officers to target their data review on specific data quality elements.
This tool significantly reduces the time required to complete in-depth data reviews and ensures that all submitted data are reviewed systematically and comprehensively. The tool also includes visual features that enable rapid identification of data quality issues of the report. Using the findings from the real-time DDIU, monitoring and evaluation staff can deploy targeted strategies to improve data quality customized to the specific challenges of the facility or district.
Pinpointing Data Discrepancies
Since October 2018, 56 RHMTs have implemented the real-time DDIU across 15 regions. PEPFAR supported 75% of implementing partners who are using this tool to improve data quality at the facility level. The rapid rollout of the DDIU is due to different elements, including:
- Integration within the existing national DHIS-2 system
- User-friendly interface
- Efficiency of the tool to detect data quality errors
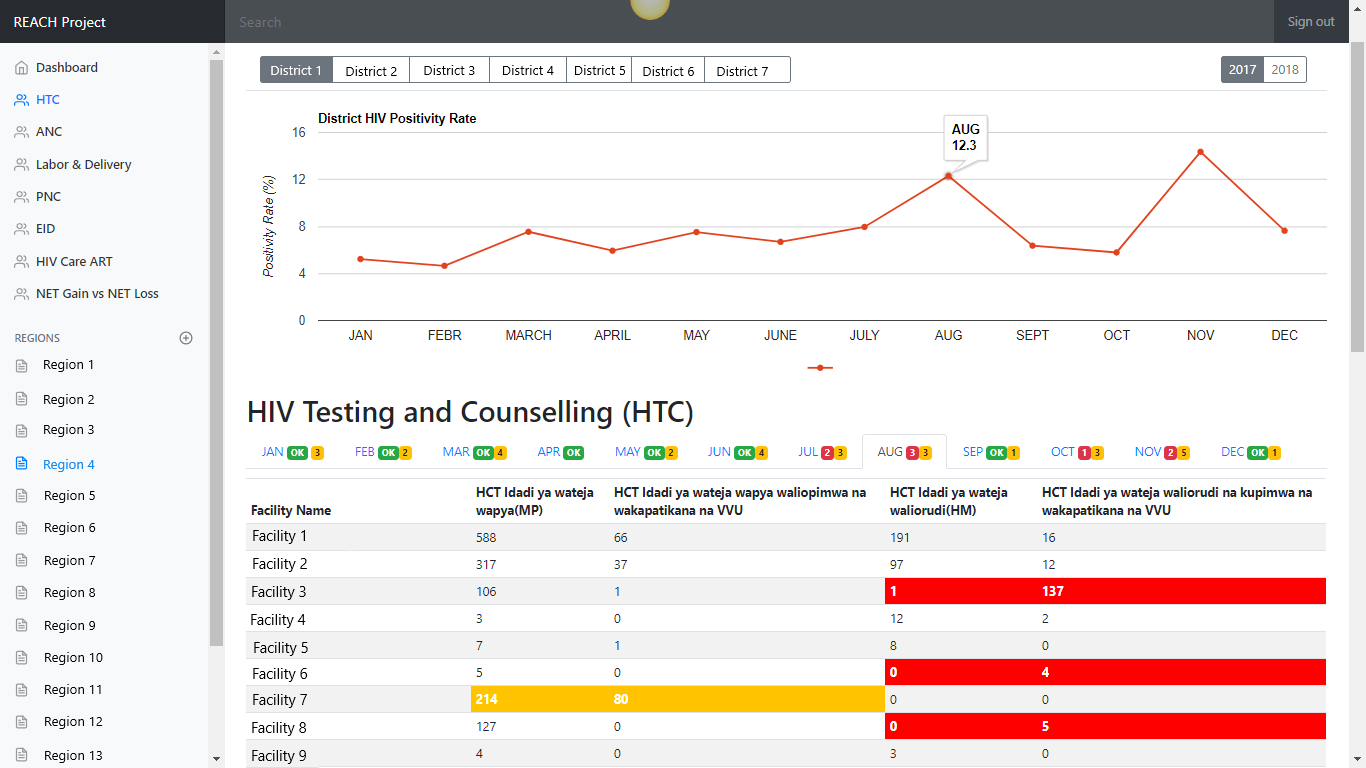
This figure shows discrepancies that have been flagged by the real-time DQA tool.
The discrepancies in red indicate that it has spotted an error. In one instance, the facility tested one person, yet that one test yielded 127 positive results, which is impossible. When the R/CHMT sees errors like this, they inform the corresponding facility and correct the data in question.
The data flagged in yellow indicates that the data needs further investigation because the positivity is high. For example, the facility tested 214 people, which yielded 80 positive results. The data might be correct, but it is worth taking a second look; if it is correct, staff can learn what was done at this facility and replicate it in other facilities to increase yield.